
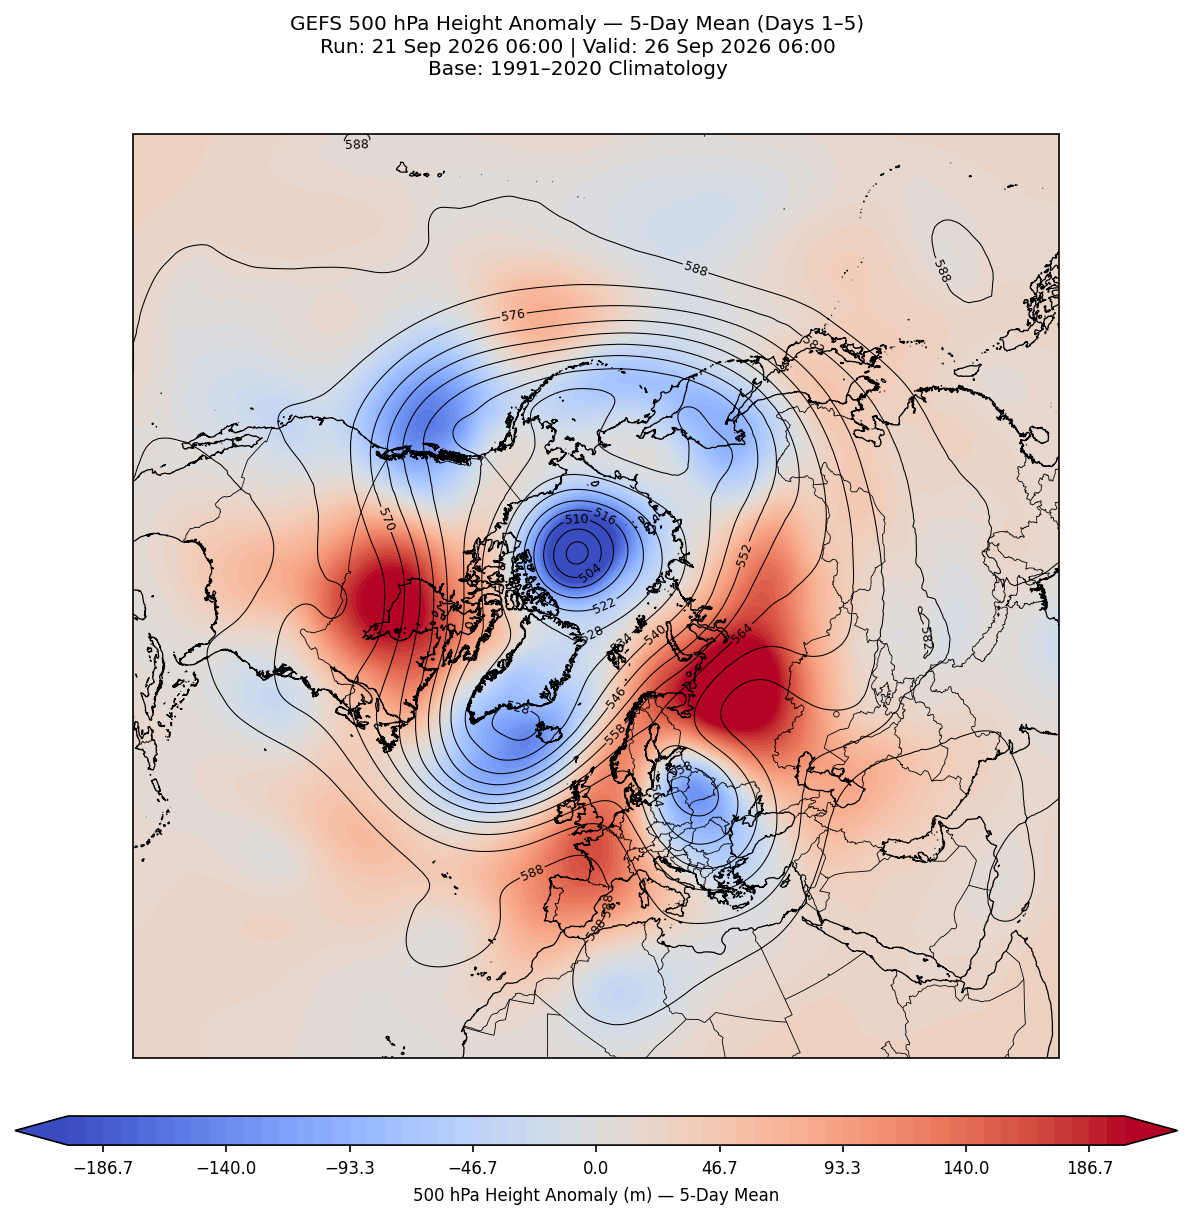
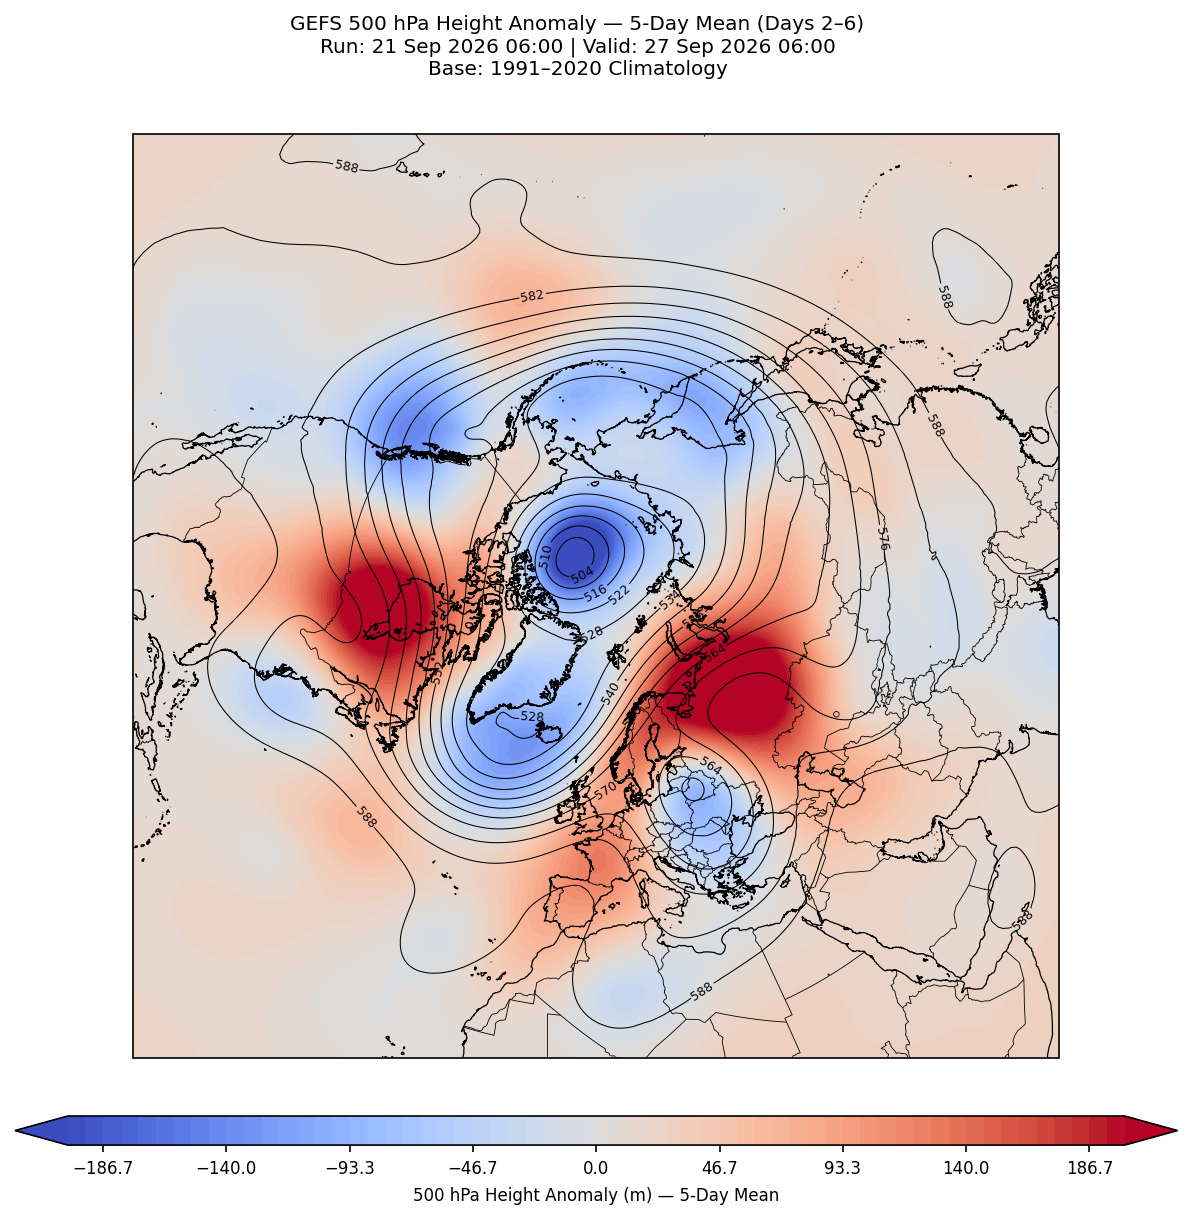
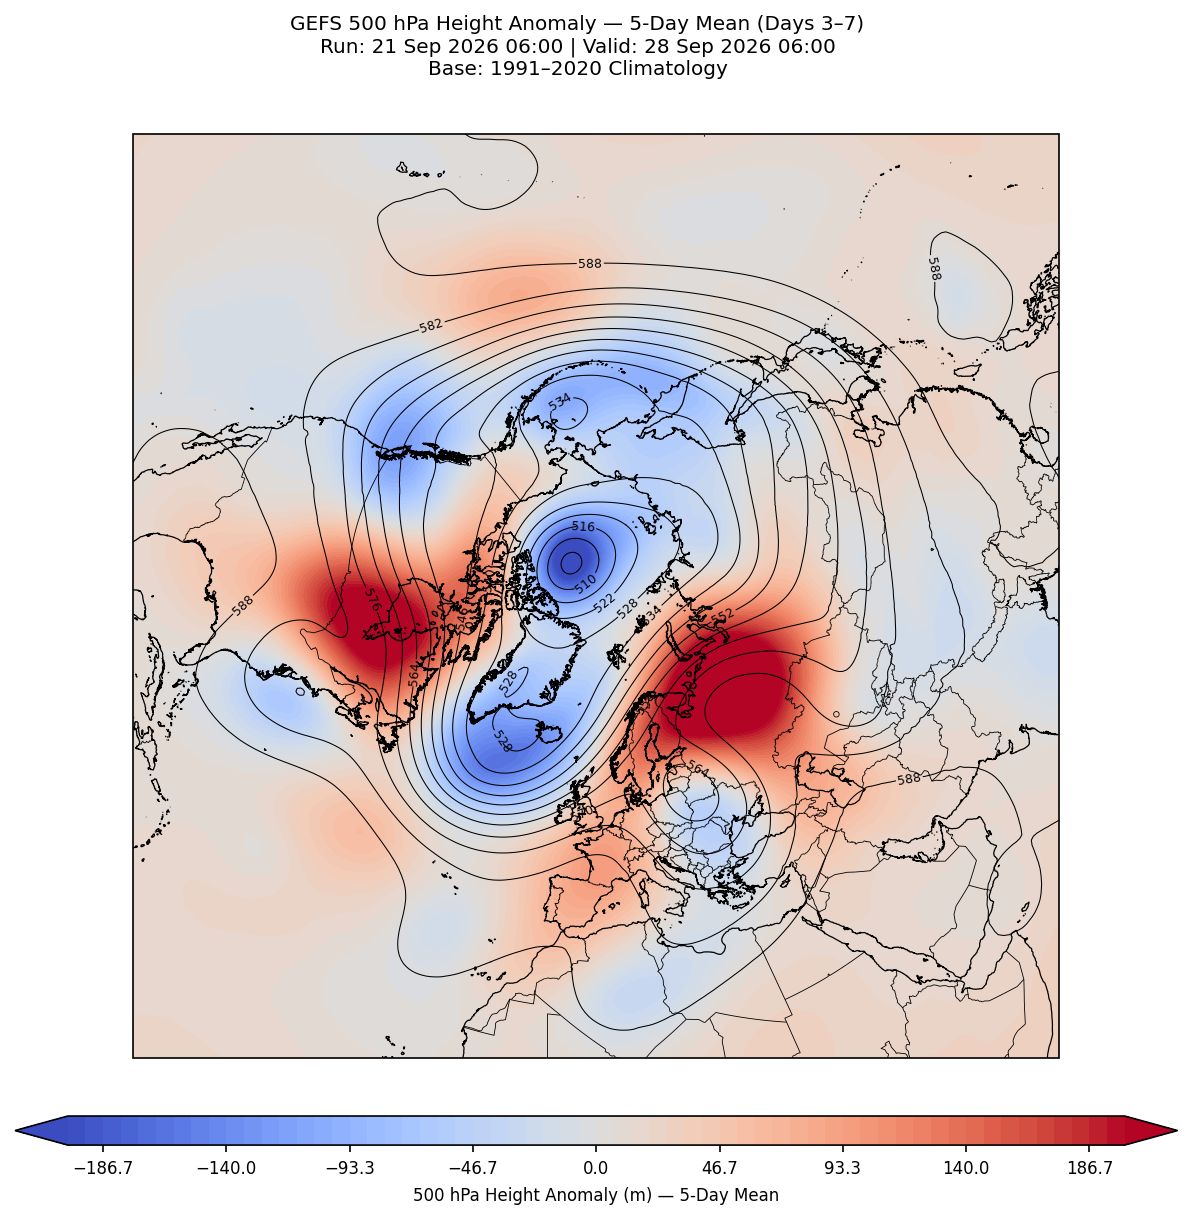
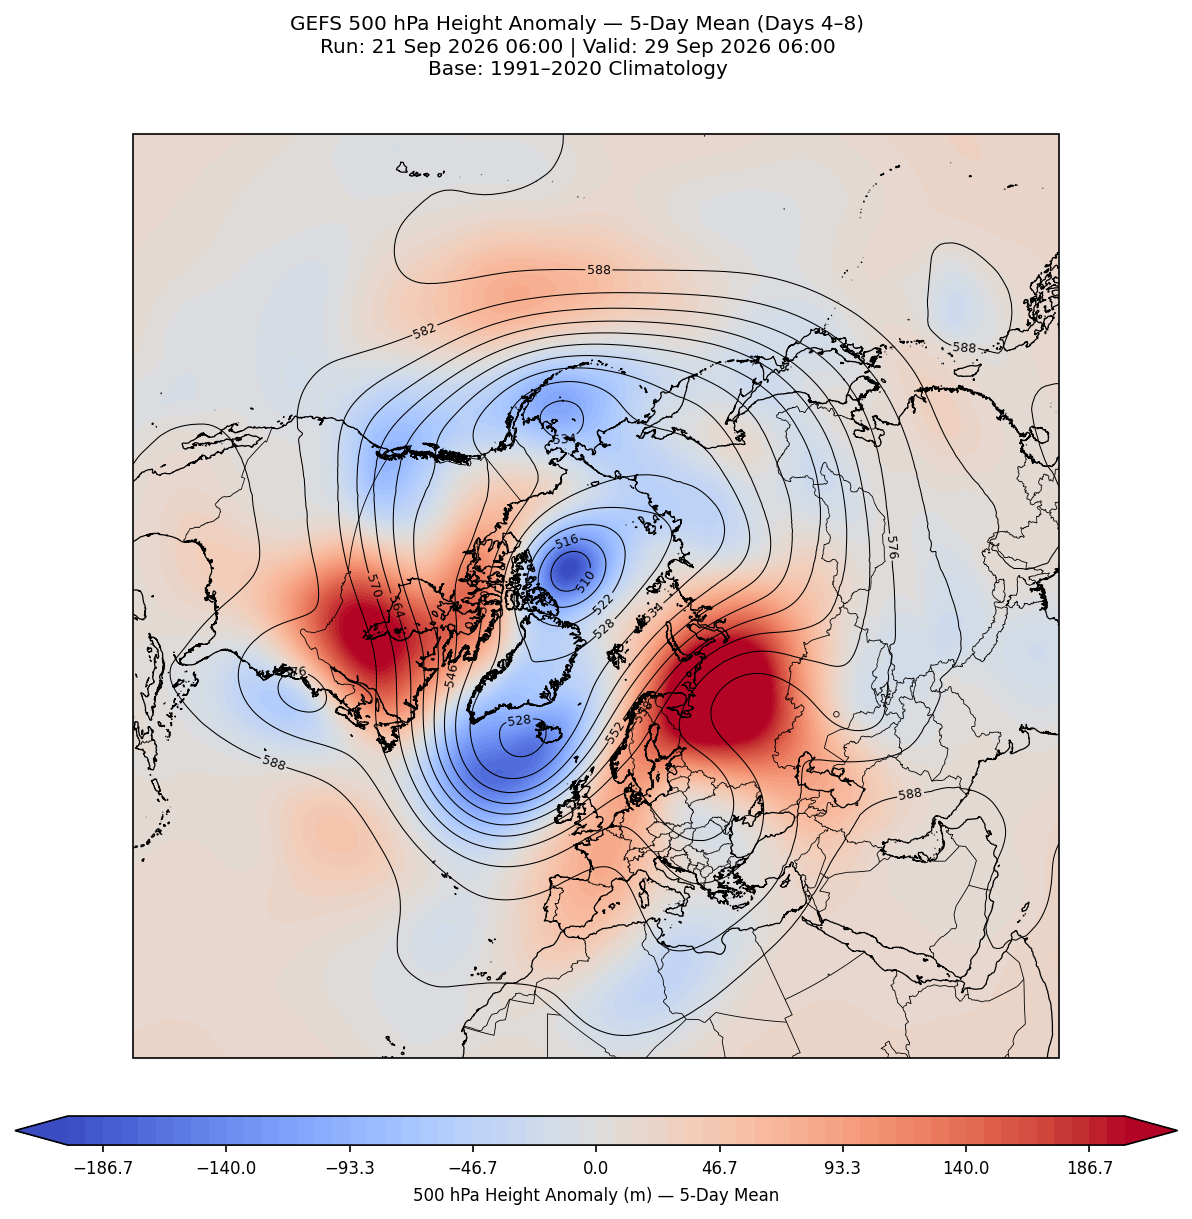
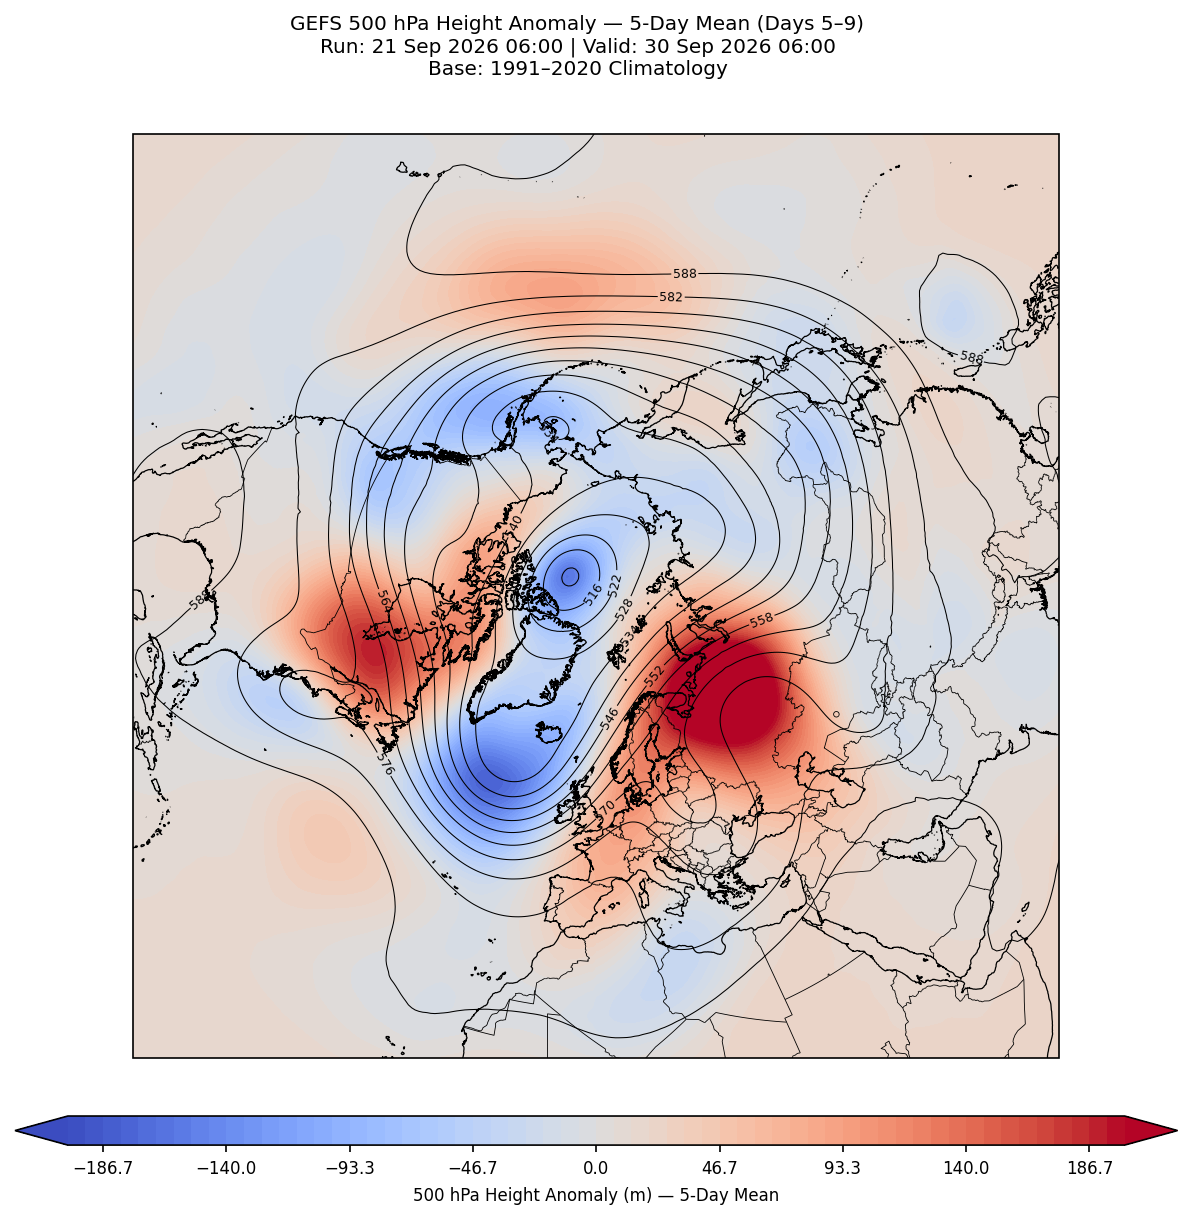
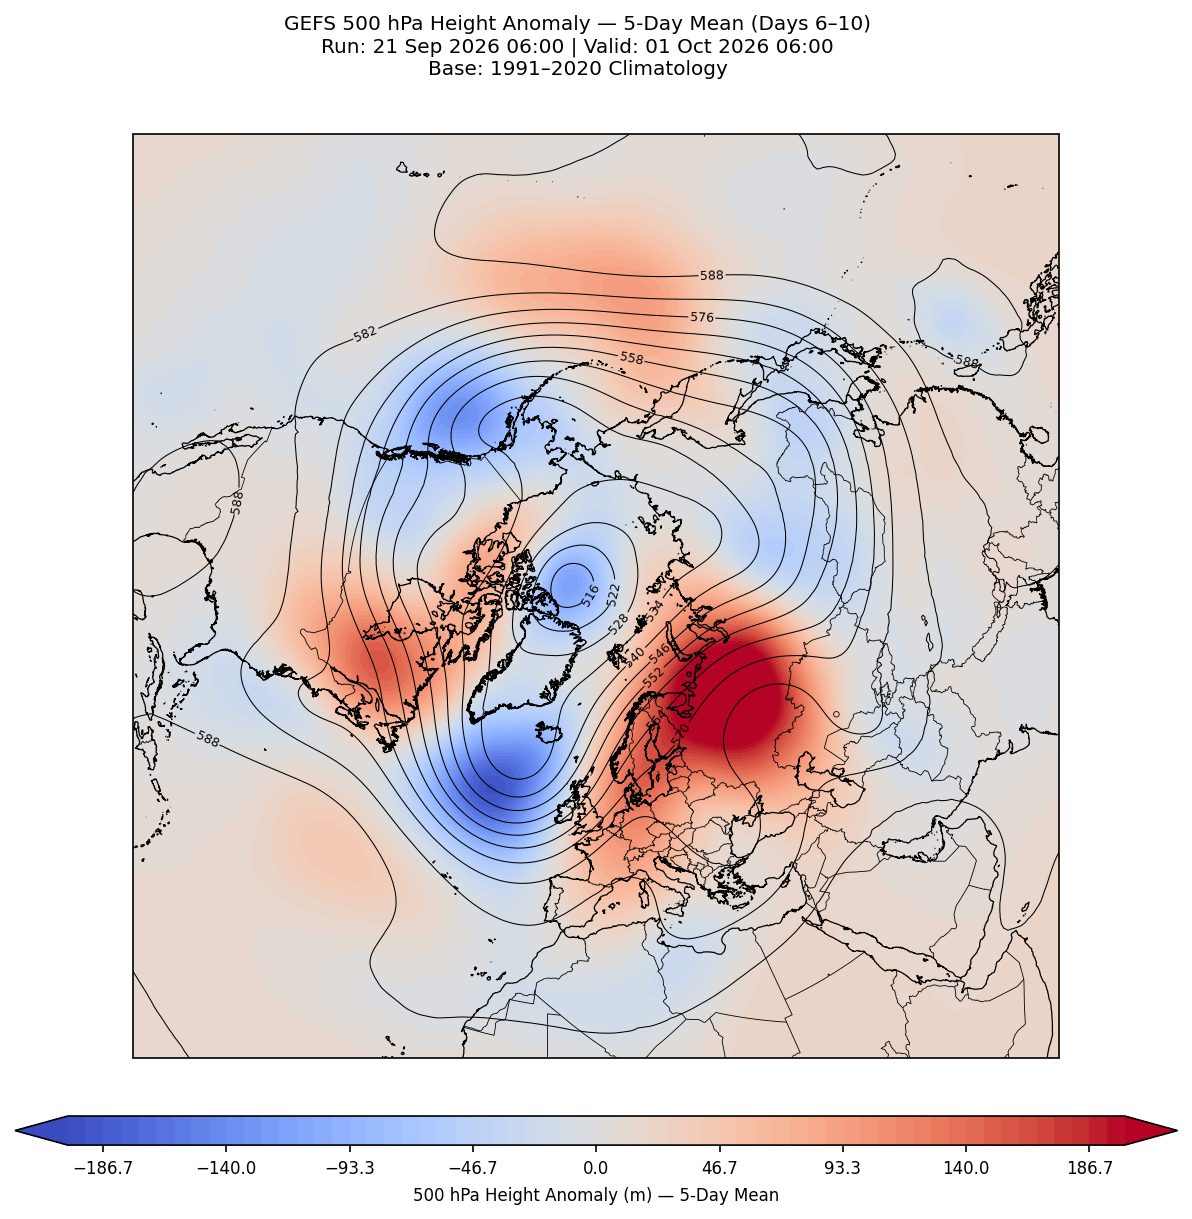
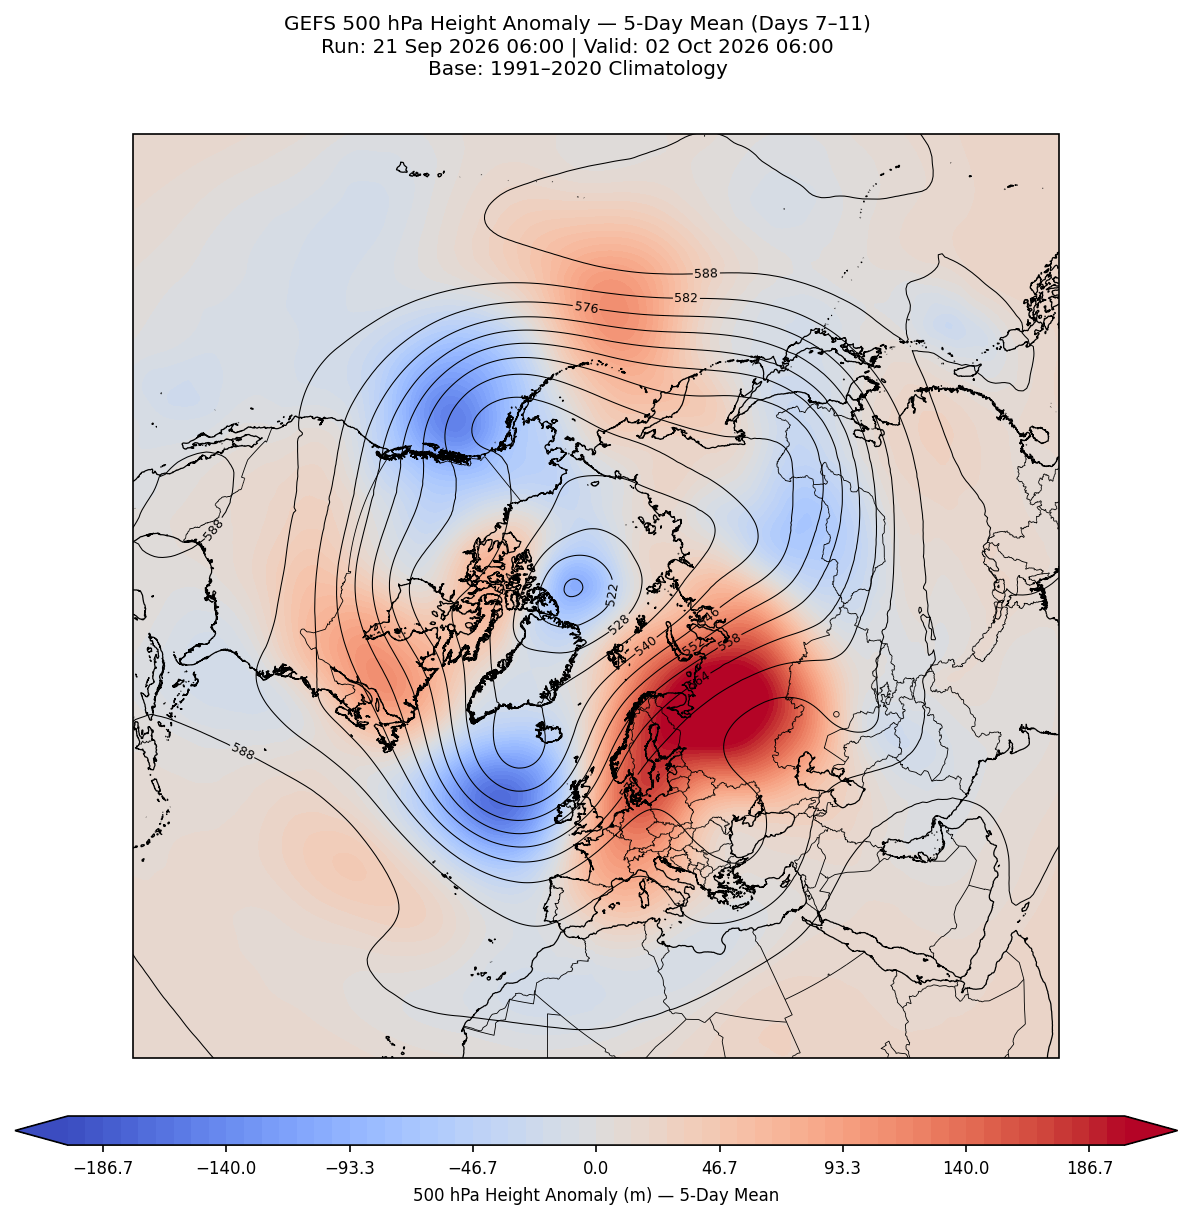
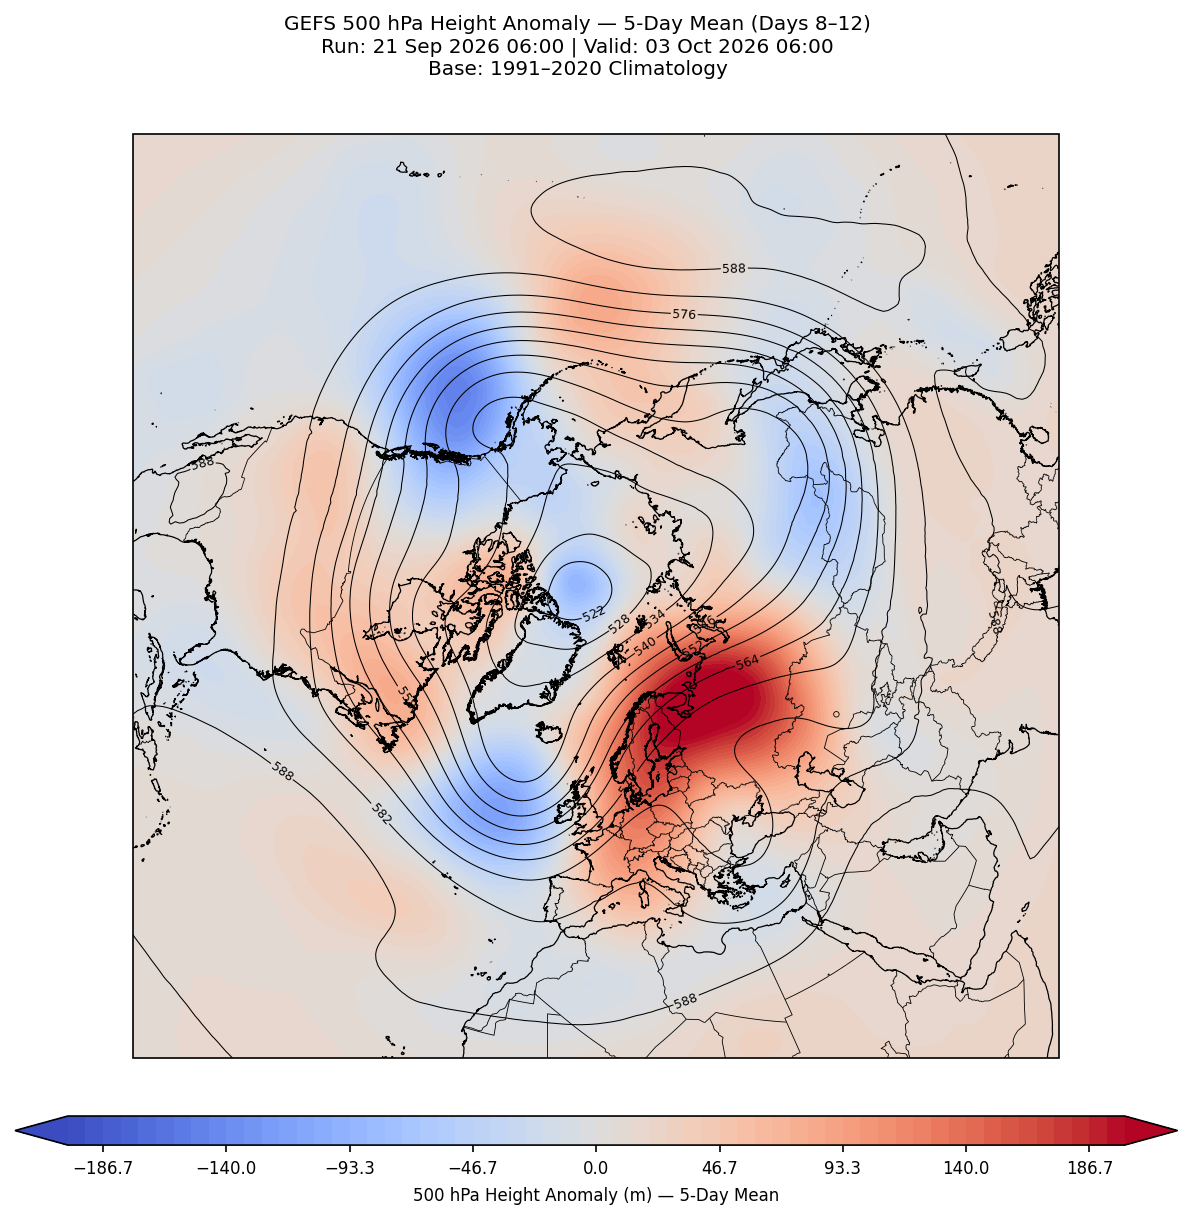
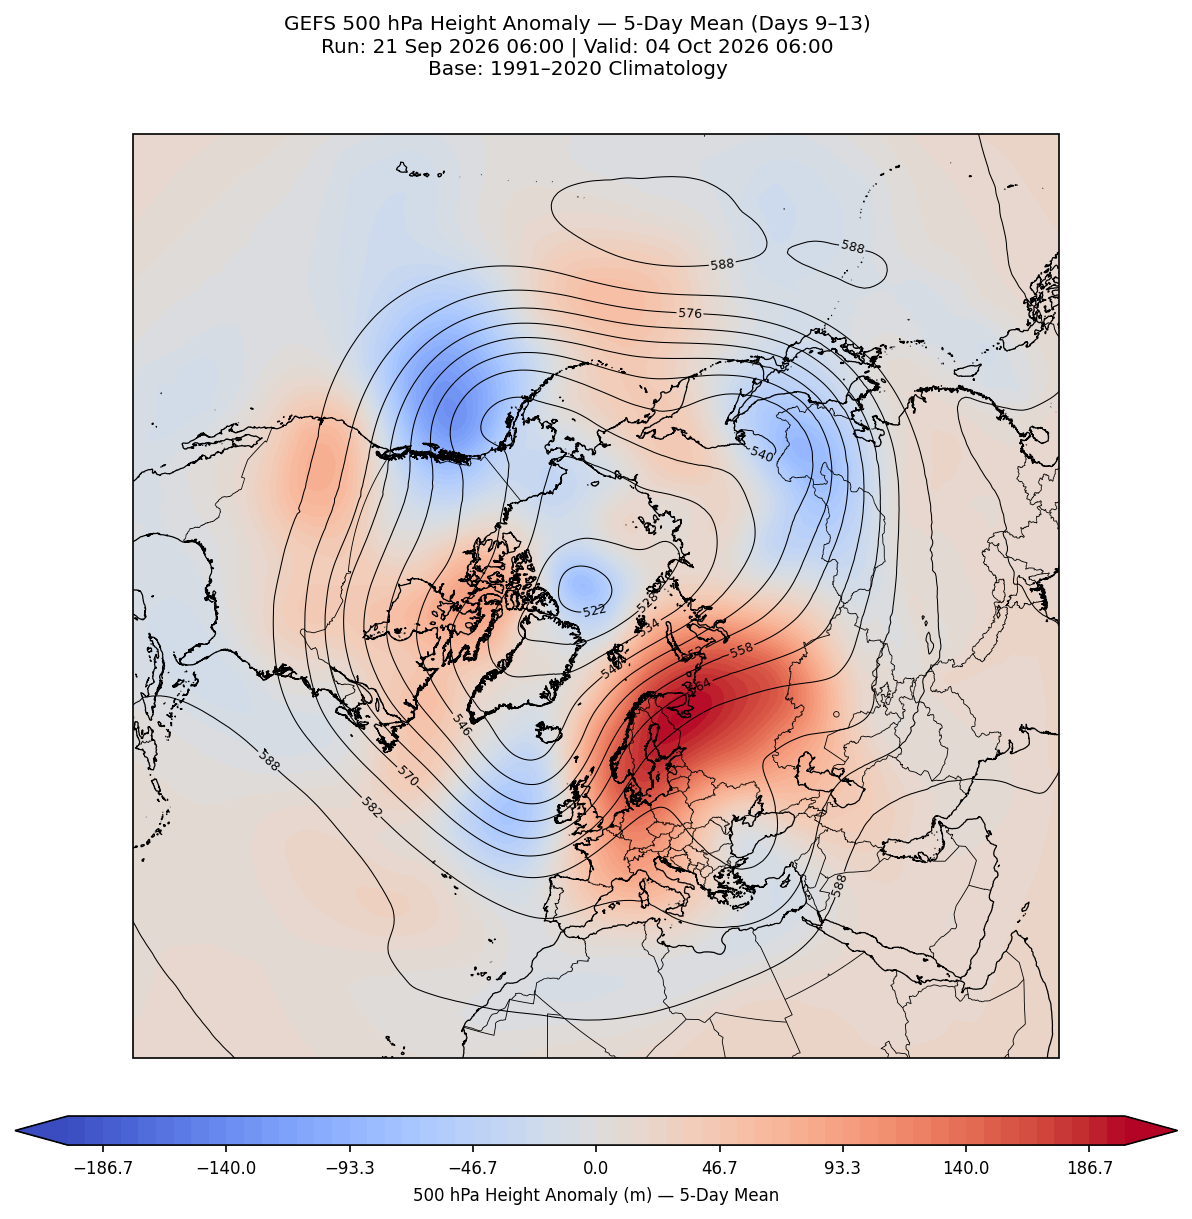
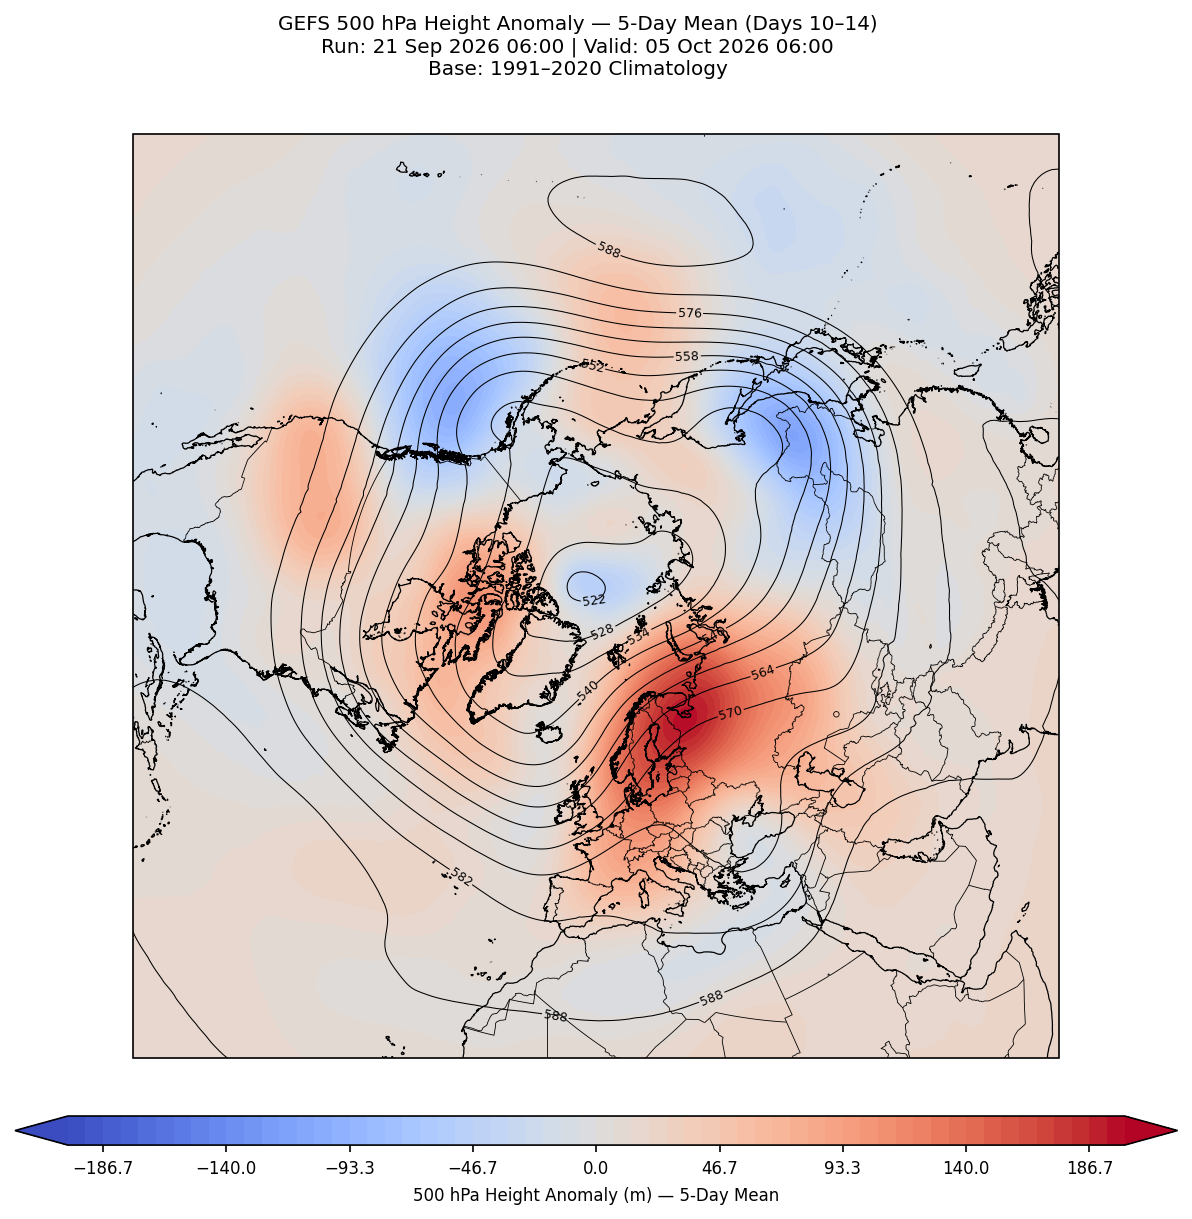
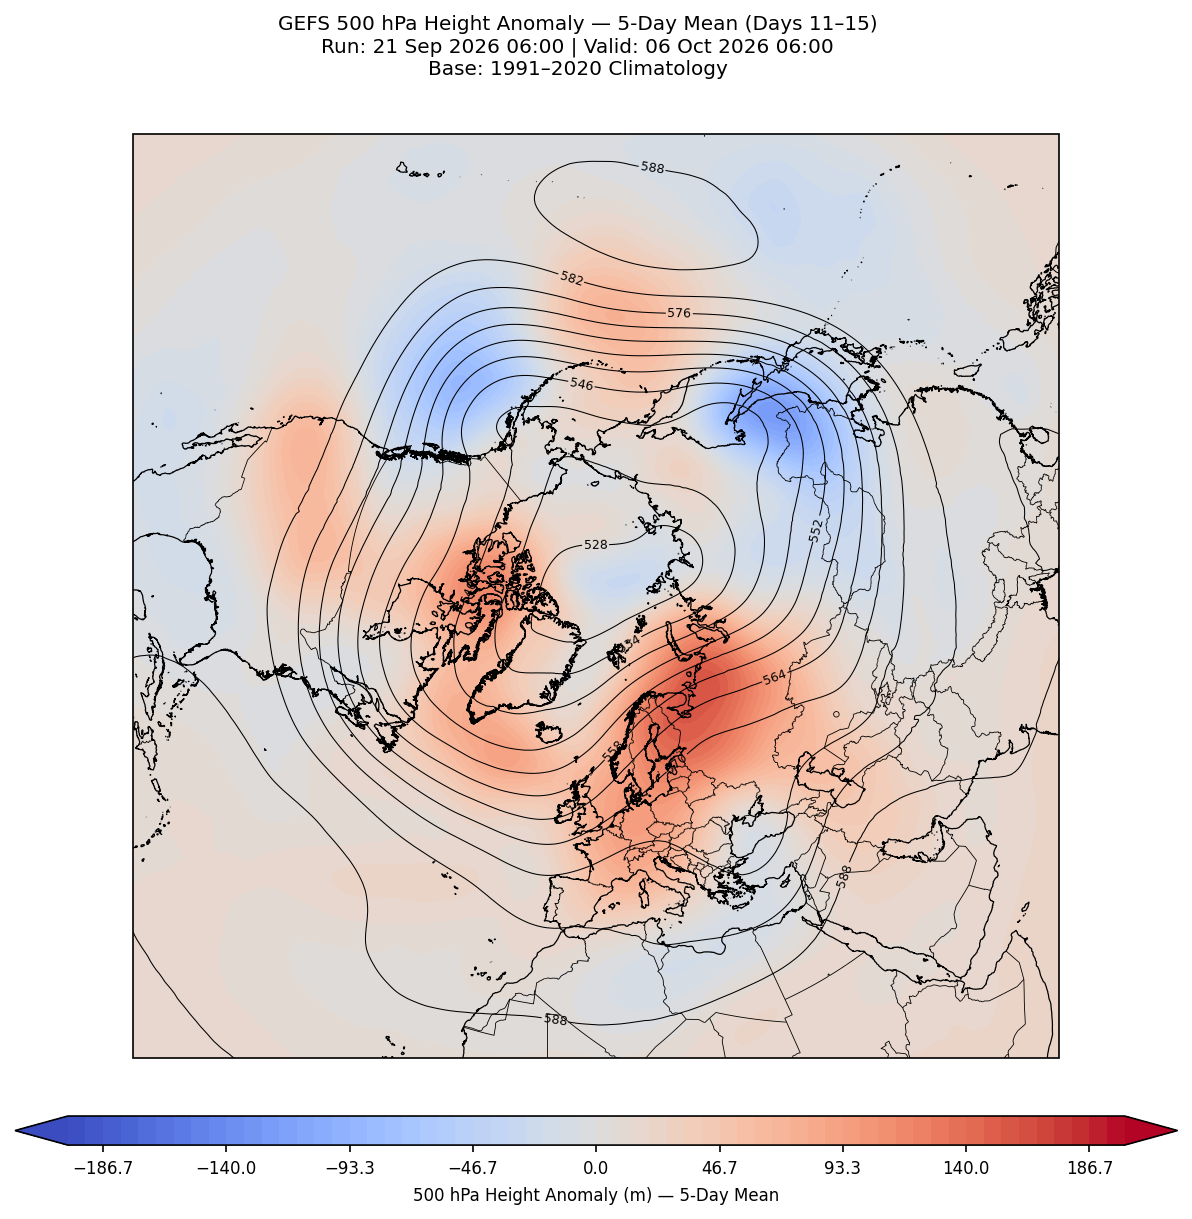
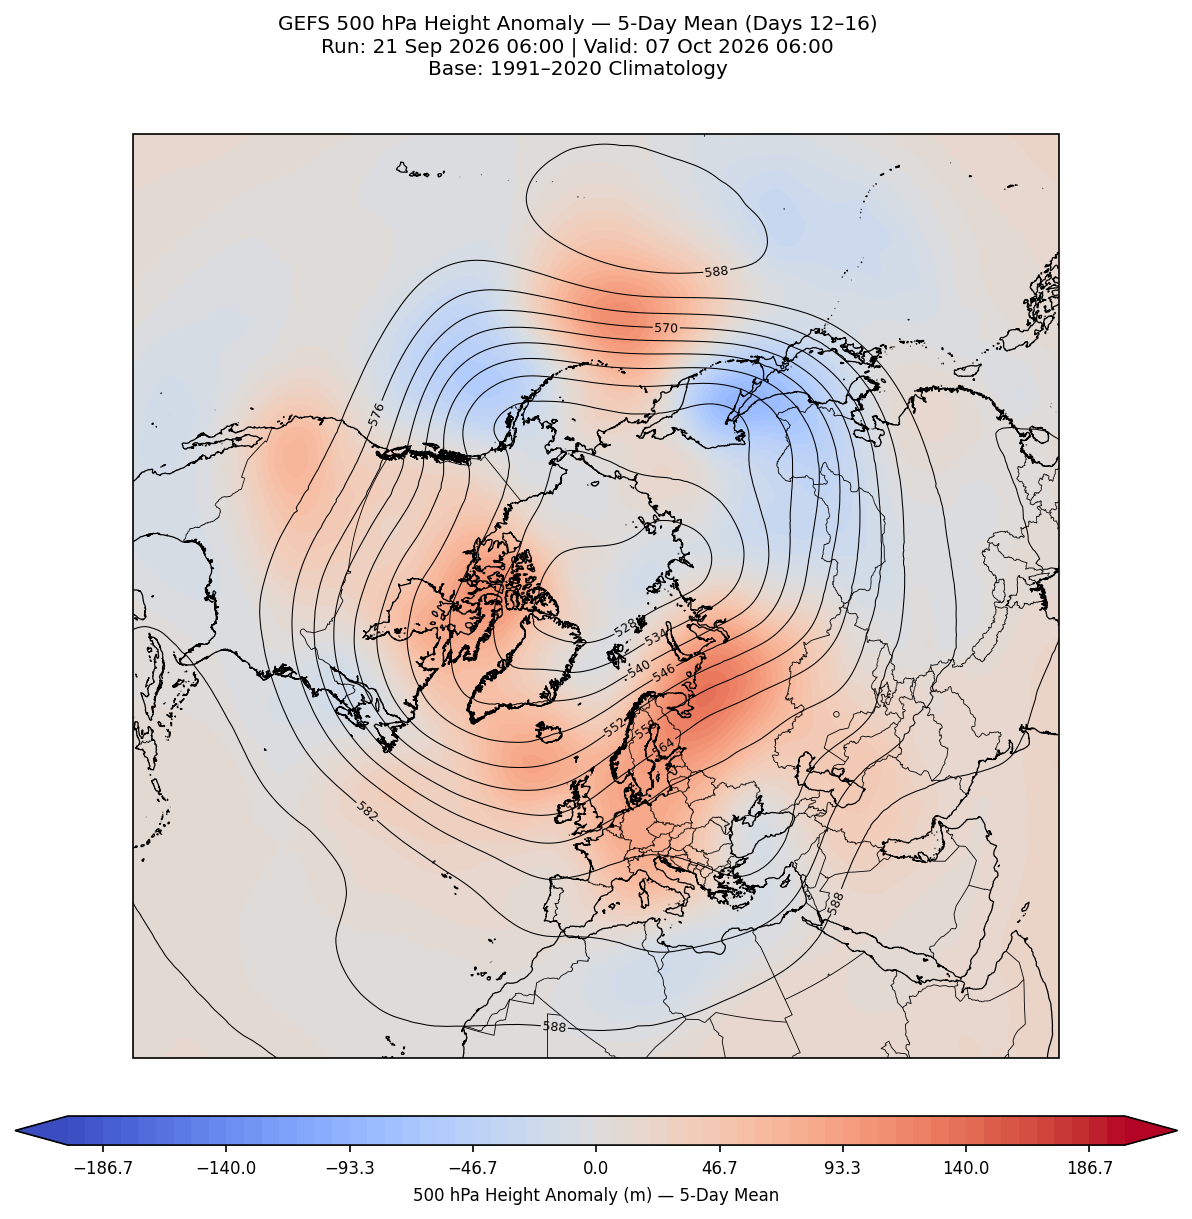
These charts show the average (mean) of all GEFS ensemble members as an anomaly, meaning how different conditions are expected to be compared with normal. Precipitation, 500mb height and 850hPa temperature anomalies help to highlight developing patterns, such as a blocking high, an unsettled spell or a cold plunge, over the UK, Europe and the Northern Hemisphere.
GEFS Mean Ave Data – Precipitation Anomaly


GEFS Mean Ave Data – 500mb Height Anomaly


GEFS Mean Ave Data – 500mb Height Anomaly NH
GEFS Mean Ave Data – 850hPa Temperature Anomaly


